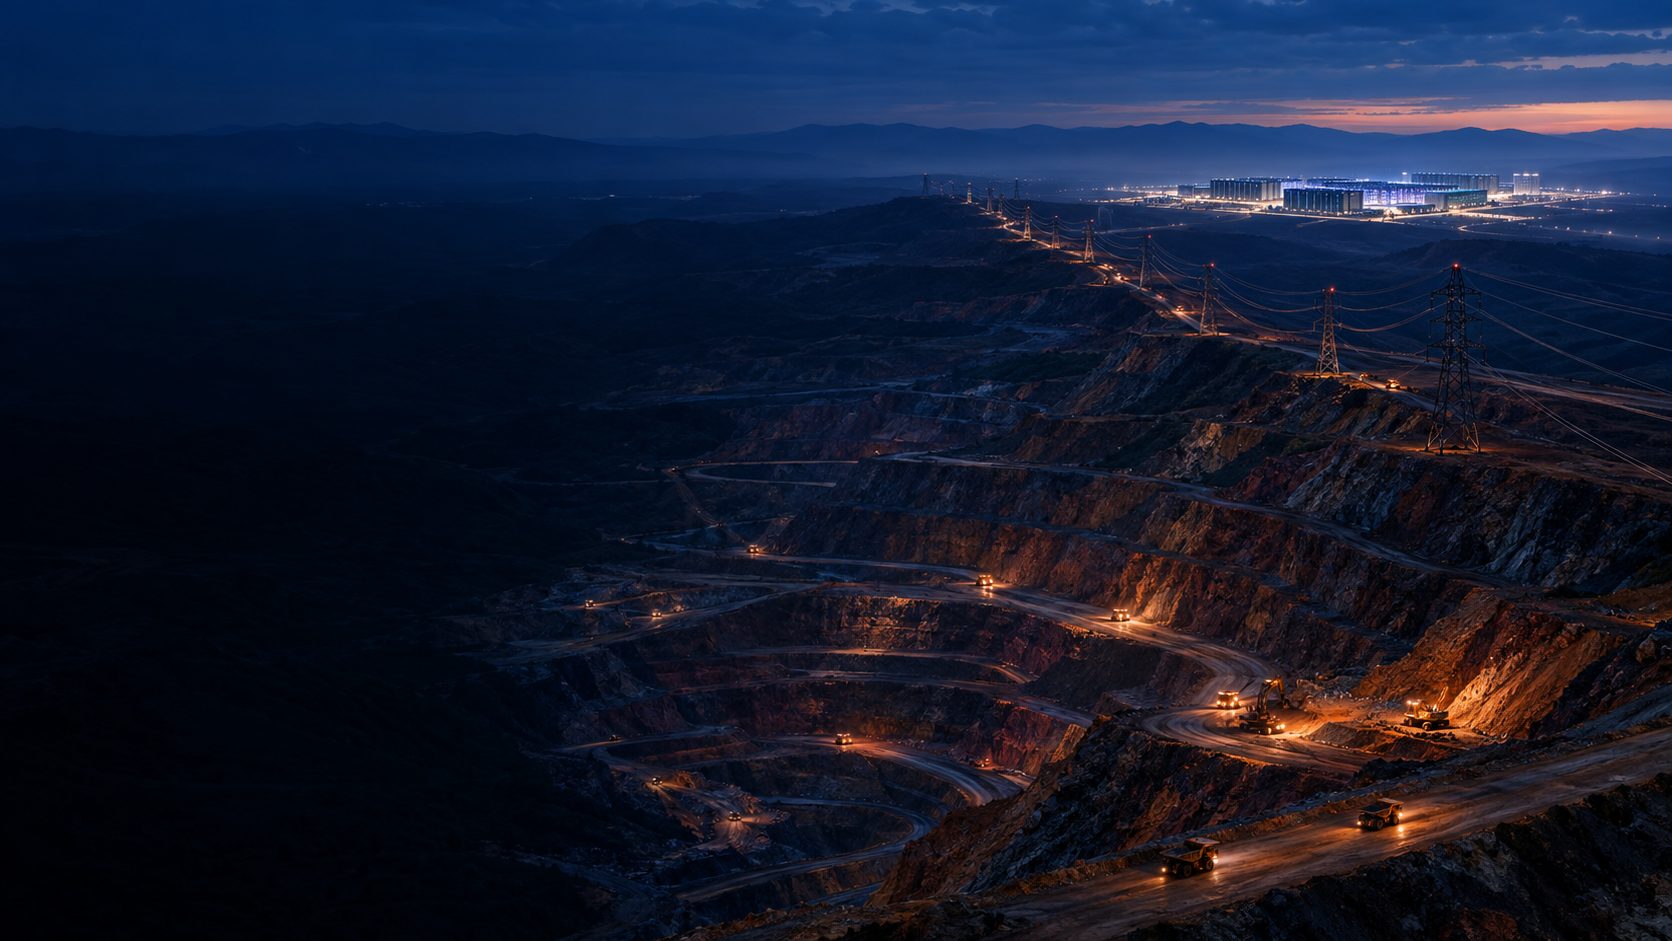
Owning the bottlenecks behind AI.
Every GPU, optical link, transformer and backup battery traces back to a mine or a refinery. This is a map of the public stocks and funds that give exposure to those minerals. They are grouped by the layer of AI infrastructure they feed and scored by how scarce the underlying supply is.
Why critical minerals are an AI trade
Three forces stack on top of each other. Each bucket below expresses them in a different proportion.
Physical demand
AI build-outs are measured in gigawatts. Most of the mineral mass in an AI data center is copper (Resources Policy), and the power to run it requires grid, generation and storage metals.
Slow supply
New mines take a decade. The IEA projects material supply gaps for copper, lithium and cobalt over the next decade (IEA), so prices, not volumes, absorb demand shocks.
Chokepoint control
China dominates supply of gallium, germanium, rare earths, graphite and tungsten and now licenses their export. Western governments are responding with equity stakes, loans and price floors (Reuters).
Where to get exposure, layer by layer
The scarcity score blends the Critical-Minerals.si supply-risk index (50%), current market status (30%) and AI linkage (20%) for the minerals in each bucket. Higher means scarcer and more AI-relevant.
Grid & power metals
The tonnage trade: copper, aluminum and transformer steel that connect every new AI campus to the grid.
Chip & optics minerals
Grams, not tons: gallium, germanium, indium and high-purity silicon inside accelerators and optical links.
Rare earths & magnets
NdFeB magnets in hard drives, cooling fans, pumps and the turbines that power data centers.
Battery & backup storage
Lithium, graphite and cobalt for the UPS systems and on-site batteries that keep AI campuses online.
Nuclear fuel for AI power
Uranium for the reactor restarts and small modular reactors hyperscalers are contracting for 24/7 power.
Strategic & defense metals
Tungsten, antimony and tin: small markets where export controls have reshaped prices.
Diversified majors & broad baskets
The ballast: global miners and broad ETFs that own a bit of everything.
Build a bucket-level allocation
Start from an illustrative model, then drag the sliders. The panel shows how scarce and AI-linked the blend is, and how to implement each bucket. These are educational frameworks, not advice.
Anchor in liquid majors and grid metals, with smaller satellites in the scarcer niches.
How to implement each bucket
Core: a copper-miner ETF (COPX) or one or two large producers. Add copper futures (CPER) to own the metal without mining risk, and an electrical-steel or aluminum name for transformer and rack exposure.
Core: one broad ETF (PICK or SETM) or two majors (BHP, Rio Tinto). Pair with targeted buckets for higher scarcity exposure.
Core: physical uranium (SRUUF) or a miner ETF (URNM, URA), plus one or two large producers. Juniors (URNJ, developers) are higher-beta satellites.
There is no clean ETF. Combine a byproduct recoverer (Teck for germanium, Korea Zinc for indium, Alcoa for gallium), a specialty processor (5N Plus, AXT) and, optionally, one downstream optics name.
Core: an established ex-China producer (Lynas or MP). Add a processor or magnet maker for the midstream, and treat developers as small satellite positions. REMX gives broad exposure but includes Chinese producers.
Core: one low-cost lithium producer (SQM or Albemarle) or a lithium-miner ETF. Add a cobalt or diversified exposure (Glencore, CMOC) and keep graphite developers small.
Hold as a small satellite: one name per metal at most (Almonty for tungsten, Perpetua or US Antimony for antimony, Alphamin for tin) or the broader REMX / SETM ETFs.
All 63 stocks, ETFs and funds
Filter by bucket, type or headquarters, and sort by size or performance. Market data as of October 6, 2026.
| Company / fund | Bucket | Minerals | Type | HQ | 12 mo | ||||
|---|---|---|---|---|---|---|---|---|---|
| BHP | BHP Group | MajorsGrid | CuFeKNi | Diversified major | AU | $221B | +56.8% | +40.6% | |
| SCCO | Southern Copper | Grid | CuMoAgZn | Producer | US | $170B | +61.1% | +38.2% | |
| RIO | Rio Tinto | MajorsGridStorage | FeCuAlLi | Diversified major | GB | $156B | +45.0% | +16.6% | |
| 601899.SS | Zijin Mining | Grid | CuAuZnLi | Producer | CN | $118B | +1.2% | -13.6% | |
| FCX | Freeport-McMoRan | Grid | CuMoAu | Producer | US | $104B | +82.9% | +36.8% | |
| GLEN.L | Glencore | StorageGridMajors | CuCoNiZn | Diversified major | CH | $89B | +64.9% | +45.4% | |
| COHR | Coherent | Chips | InSiC | Downstream user | US | $66B | +198% | +76.5% | |
| VALE | Vale | StorageMajors | FeNiCu | Diversified major | BR | $60B | +27.9% | +6.4% | |
| AAL.L | Anglo American | MajorsGrid | CuFePtPd | Diversified major | GB | $59B | +47.6% | +37.8% | |
| 603993.SS CMCLF | CMOC Group | StorageGrid | CoCuMoW+1 | Producer | CN | $54B | +7.5% | -15.6% | |
| ANTO.L ANFGF | Antofagasta | Grid | CuMoAu | Producer | GB | $50B | +41.0% | +18.8% | |
| CCJ | Cameco | Uranium | U | Producer | CA | $41B | +10.5% | +0.2% | |
| TECK | Teck Resources | GridChips | CuZnGeIn | Producer | CA | $32B | +55.2% | +40.3% | |
| FQVLF | First Quantum Minerals | Grid | CuNiAu | Producer | CA | $23B | +21.2% | +3.2% | |
| 600362.SS | Jiangxi Copper | Grid | CuAu | Producer | CN | $22B | +17.8% | -23.9% | |
| 600111.SS | China Northern Rare Earth | Magnets | NdLaCe | Producer | CN | $19B | -26.9% | -23.5% | |
| SQM | SQM | Storage | LiK | Producer | CL | $19B | +53.5% | -7.6% | |
| KAP.L | Kazatomprom | Uranium | U | Producer | KZ | $17B | +25.5% | +22.0% | |
| 010130.KS | Korea Zinc | Chips | ZnPbInSb+4 | Refiner / processor | KR | $17B | +20.7% | -13.9% | |
| 002460.SZ | Ganfeng Lithium | Storage | Li | Producer | CN | $14B | -28.7% | -30.9% | |
| ALB | Albemarle | Storage | Li | Producer | US | $13B | +20.6% | -29.1% | |
| HBM | Hudbay Minerals | Grid | CuZnAu | Producer | CA | $12B | +71.2% | +33.3% | |
| IVN.TO IVPAF | Ivanhoe Mines | Grid | CuZnGePt | Producer | CA | $12B | -20.8% | -23.9% | |
| AA | Alcoa | GridChips | AlGa | Producer | US | $11B | +25.1% | -20.4% | |
| 002466.SZ | Tianqi Lithium | Storage | Li | Producer | CN | $10B | -15.4% | -27.3% | |
| LYC.AX LYSDY | Lynas Rare Earths | Magnets | NdPrDyTb | Producer | AU | $9.1B | -33.4% | +2.5% | |
| MP | MP Materials | Magnets | NdPrLaCe+1 | Producer | US | $8.6B | -32.1% | -9.1% | |
| PLS.AX | PLS Group (Pilbara Minerals) | Storage | LiTa | Producer | AU | $8.6B | +47.1% | -13.0% | |
| 000831.SZ | China Rare Earth Resources & Technology | Magnets | DyTbLaCe | Producer | CN | $8.4B | +1.9% | +13.5% | |
| COPX | Global X Copper Miners ETF | Grid | Cu | ETF | US | $8.0B | +39.2% | +14.0% | |
| CLF | Cleveland-Cliffs | Grid | GOESFe | Refiner / processor | US | $7.0B | -3.9% | -11.4% | |
| NXE | NexGen Energy | Uranium | U | Developer | CA | $6.2B | +8.1% | +1.9% | |
| SRUUF | Sprott Physical Uranium Trust | Uranium | U | Commodity fund | US | $6.2B | +2.8% | +0.7% | |
| UMI.BR UMICY | Umicore | ChipsStorage | CoNiGePt | Refiner / processor | BE | $5.7B | +39.5% | +18.1% | |
| WCH.DE | Wacker Chemie | Chips | Si | Refiner / processor | DE | $5.1B | +37.2% | +36.2% | |
| UEC | Uranium Energy Corp | Uranium | UTi | Producer | US | $5.0B | -23.5% | -17.2% | |
| AXTI | AXT Inc | Chips | InGaGe | Refiner / processor | US | $4.3B | +1539% | +447% | |
| URA | Global X Uranium ETF | Uranium | U | ETF | US | $4.2B | -15.7% | -8.9% | |
| ALM | Almonty Industries | Strategic | W | Producer | US | $3.7B | +107% | +37.7% | |
| CENX | Century Aluminum | Grid | Al | Producer | US | $3.7B | +24.5% | -7.5% | |
| UUUU | Energy Fuels | MagnetsUranium | UVDyTb | Producer | US | $2.8B | -31.8% | -23.1% | |
| PPTA | Perpetua Resources | Strategic | SbAu | Developer | US | $2.6B | -5.6% | -20.5% | |
| DNN | Denison Mines | Uranium | U | Developer | CA | $2.5B | -3.2% | +0.7% | |
| PICK | iShares MSCI Global Metals & Mining Producers ETF | Majors | CuFeAl | ETF | US | $2.3B | +34.5% | +16.8% | |
| VNP.TO FPLSF | 5N Plus | Chips | GeTeBi | Refiner / processor | CA | $2.1B | +84.4% | +77.1% | |
| USAR | USA Rare Earth | MagnetsStrategic | Nd | Developer | US | $1.8B | -47.1% | +1.7% | |
| ILU.AX ILKAF | Iluka Resources | Magnets | ZrTi | Producer | AU | $1.8B | -21.7% | -0.2% | |
| LIT | Global X Lithium & Battery Tech ETF | Storage | Li | ETF | US | $1.4B | +20.7% | +4.7% | |
| AFM.V AFMJF | Alphamin Resources | Strategic | Sn | Producer | MU | $1.3B | +25.0% | +21.8% | |
| URNM | Sprott Uranium Miners ETF | Uranium | U | ETF | US | $1.2B | -15.7% | -10.1% | |
| NEO.TO NOPMF | Neo Performance Materials | Magnets | Nd | Refiner / processor | CA | $896M | +36.3% | +92.2% | |
| REMX | VanEck Rare Earth & Strategic Metals ETF | MagnetsStrategicMajors | NdLiW | ETF | US | $829M | -13.0% | -16.9% | |
| GSM | Ferroglobe | Chips | SiMn | Refiner / processor | GB | $817M | -13.9% | -8.1% | |
| ARU.AX ARAFF | Arafura Rare Earths | Magnets | NdPr | Developer | AU | $700M | -25.0% | -36.5% | |
| UAMY | United States Antimony | Strategic | Sb | Refiner / processor | US | $591M | -48.5% | -36.1% | |
| LAC | Lithium Americas | Storage | Li | Developer | CA | $567M | -71.9% | -45.8% | |
| CPER | United States Copper Index Fund | Grid | Cu | Commodity fund | US | $254M | +27.8% | +11.8% | |
| URNJ | Sprott Junior Uranium Miners ETF | Uranium | U | ETF | US | $205M | -26.8% | -17.6% | |
| SETM | Sprott Critical Materials ETF | MajorsStrategic | LiUCuNd | ETF | US | $80M | +13.9% | -1.2% | |
| WWR | Westwater Resources | Storage | C | Developer | US | $62M | -60.0% | -41.9% | |
| SYR.AX SRHYY | Syrah Resources | Storage | CV | Producer | AU | $58M | -76.4% | -76.8% | |
| COPP | Sprott Copper Miners ETF | Grid | Cu | ETF | US | $52M | +46.5% | +18.5% | |
| LITP | Sprott Lithium Miners ETF | Storage | Li | ETF | US | $27M | -8.3% | -29.7% |
When the government is a co-investor
Washington and allied governments now take equity, extend loans and set price floors in mineral companies. That support lowers financing risk but makes returns depend on policy as well as markets.
| Company | Bucket | Government support | Mkt cap | 1 yr |
|---|---|---|---|---|
Teck Resources TECK | Grid, Chips | Canada Growth Fund and Natural Resources Canada agreed to fund strategic-metals output at the Trail smelter. Teck, Jul 7 2026 ↗ | $32B | +55.2% |
Cleveland-Cliffs CLF | Grid | Defense Logistics Agency awarded a $400M sole-source contract for grain-oriented electrical steel. Defence Blog, Jul 2026 ↗ | $7.0B | -3.9% |
Alcoa AA | Grid, Chips | US Department of Defense committed a $174M equity investment to the Wagerup gallium project. Asia Times, Sep 2026 ↗ | $11B | +25.1% |
Korea Zinc 010130.KS | Chips | Pentagon to hold 40% of the Tennessee smelter joint venture; US strategic investors get about 10% of Korea Zinc. Reuters, Jun 17 2026 ↗ | $17B | +20.7% |
MP Materials MP | Magnets | US Department of Defense holds about a 15% stake, its largest shareholder, alongside a 10-year NdPr price floor and magnet offtake. Reuters, Jun 17 2026 ↗ | $8.6B | -32.1% |
USA Rare Earth USAR | Magnets, Strategic | Administration taking a 10% stake as part of a $1.6B debt-and-equity package. CNBC, Jan 24 2026 ↗ | $1.8B | -47.1% |
Lithium Americas LAC | Storage | US Department of Energy took 5% of the company and 5% of the Thacker Pass JV. Reuters, Oct 1 2025 ↗ | $567M | -71.9% |
Perpetua Resources PPTA | Strategic | EXIM Bank approved a $2.9B loan for Stibnite. CNBC, May 21 2026 ↗ | $2.6B | -5.6% |
The US has also taken stakes in private or smaller companies not listed here, including Trilogy Metals and Vulcan Elements (Reuters; Mayer Brown).
Four ways to get exposure
Each vehicle trades purity of exposure against risk. Most allocations mix several.
Diversified majors
Liquid, dividend-paying and diversified across mines. Critical-mineral exposure is diluted by iron ore and coal.
ETFs & commodity funds
One ticker, many names. Commodity funds track the metal itself. Check holdings: some ETFs carry heavy China or downstream exposure.
Pure-play producers
Revenue tied closely to one mineral. The cleanest way to express a scarcity view, with single-commodity and single-asset risk.
Developers & processors
Pre-production or midstream bets on where the bottleneck will be. Binary outcomes, dilution and policy dependence.
Investing in critical minerals: key questions
Not investment advice. Critical-Minerals.si is an independent research site. Baskets and model allocations are illustrative frameworks for exploring exposure, not recommendations to buy or sell any security. Mining and commodity equities are volatile, and many names listed here are small, foreign-listed or pre-revenue. Do your own research and consider a licensed adviser. Market data as of the date shown; prices change constantly.
How can I invest in critical minerals for AI?
Through four kinds of listed vehicles: diversified mining majors, pure-play producers and developers, refiners and processors, and ETFs or commodity funds that hold a basket of miners or the metal itself. Critical-Minerals.si groups 63 of them into seven buckets mapped to the layers of an AI data center.
Which critical minerals are most tied to AI data centers?
Copper and electrical steel dominate by tonnage because of power and grid needs. Gallium, germanium and indium are the sharpest chokepoints for chips and optical networking. Rare earths feed magnets in drives, cooling and generators, uranium feeds nuclear power contracts, and lithium feeds backup storage.
Is there a single ETF for critical minerals?
No single ETF covers the theme cleanly. Broad options include PICK (global metals and mining) and SETM (Sprott Critical Materials). Narrower ETFs exist for copper (COPX, COPP), uranium (URA, URNM), lithium (LIT, LITP) and rare earths (REMX). There is no ETF for gallium, germanium or indium.
Why does the US government own stakes in mining companies?
To secure supply chains dominated by China, US agencies have taken equity in companies including MP Materials, Lithium Americas and USA Rare Earth. They have also funded projects through loans, price floors and offtake agreements. Government backing can lower financing risk but ties returns to policy.
What are the biggest risks of investing in critical minerals?
Commodity price cycles, Chinese supply or policy shifts that collapse Western price premiums, single-mine and country risk, dilution at pre-revenue developers, and thin liquidity in small and foreign-listed shares. AI demand is real but is often a smaller share of total demand than EVs, construction or defense.
Market data (prices, market capitalization, fund size, 52-week ranges and weekly closes) from Perplexity Finance as of October 6, 2026. Non-USD market caps converted at same-day FX rates. One-year return uses weekly closes from early October 2025; YTD uses the last close of 2025. Company descriptions are Critical-Minerals.si summaries; government-support details link to their sources.